
Want more housing market stories from Lance Lambert’s ResiClub in your inbox? Subscribe to the ResiClub newsletter.
Zillow economists use an economic model known as the Zillow Market Heat Index to gauge the competitiveness of housing markets across the country.
This model looks at key indicators—including home price changes, inventory levels, and days on the market—to generate a score showing whether a market favors sellers or buyers.
Higher scores point to hotter, seller-friendly metro housing markets. Lower scores signal cooler markets where buyers hold more negotiating power.
According to Zillow:
- Score of 70 or higher = strong seller’s market
- Score from 55 to 69 = seller’s market
- Score from 44 to 55 = neutral market
- Score from 28 to 44 = buyer’s market
- Score of 27 or lower = strong buyer’s market
Nationally, Zillow rates the U.S. housing market at 55 in spring 2026.
That said, Zillow’s reading varies significantly across the country.
window.addEventListener(“message”,function(a){if(void 0!==a.data[“datawrapper-height”]){var e=document.querySelectorAll(“iframe”);for(var t in a.data[“datawrapper-height”])for(var r,i=0;r=e[i];i++)if(r.contentWindow===a.source){var d=a.data[“datawrapper-height”][t]+”px”;r.style.height=d}}});
Among the 250 largest metro-area housing markets, these 20 are the hottest markets, where sellers have the most power:
- Rochester, New York → 174
- Buffalo → 115
- Racine, Wisconsin → 109
- Syracuse, New York → 107
- San Francisco → 105
- Charleston, West Virginia → 103
- Manchester, New Hampshire → 96
- Hartford, Connecticut → 94
- San Jose → 90
- Albany, New York → 90
- Milwaukee → 87
- Bridgeport, Connecticut → 85
- Rochester, Minnesota → 84
- Poughkeepsie, New York → 81
- Madison, Wisconsin → 81
- Ann Arbor, Michigan → 81
- Boston → 80
- Grand Rapids, Michigan → 80
- Springfield, Massachusetts → 79
- Abilene, Texas → 79
Among the 250 largest metro-area housing markets, these 20 are the coldest markets, where buyers have the most power:
- Macon, Georgia → 25
- Terre Haute, Indiana → 25
- Florence, South Carolina → 27
- Naples, Florida → 29
- Brownsville, Texas → 30
- Gulfport, Mississippi → 30
- Longview, Texas → 30
- Jackson, Tennessee → 34
- Fort Smith, Arkansas → 35
- Punta Gorda, Florida → 36
- McAllen, Texas → 37
- Cape Coral, Florida → 37
- Miami → 38
- Fayetteville, Arkansas → 38
- Asheville, NC → 38
- Laredo, Texas → 38
- Panama City, Florida → 38
- North Port, Florida → 39
- Port St. Lucie, Florida → 39
- Corpus Christi, Texas → 39
Does ResiClub agree with Zillow’s assessment?
Directionally, ResiClub agrees with Zillow’s identification of regional housing markets where buyers have gained the most leverage—particularly along the Gulf Coast—as well as markets where sellers have retained relatively more control, including parts of the Northeast and Midwest.
That said, while many Northeast and Midwest markets still tilt toward sellers compared to the rest of the country, ResiClub believes Zillow somewhat overstates the degree of seller strength based on other market indicators.
Based on ResiClub’s housing analysis, much of Florida (particularly Southwest Florida) and chunks of Texas (particularly areas with a lot of new single-family home construction) are the softest chunk of the U.S. housing market, where buyers have the most power. Not too far behind are pockets of Colorado, Georgia, and Arizona, where homebuilders have been clearing some built-up unsold spec inventory.
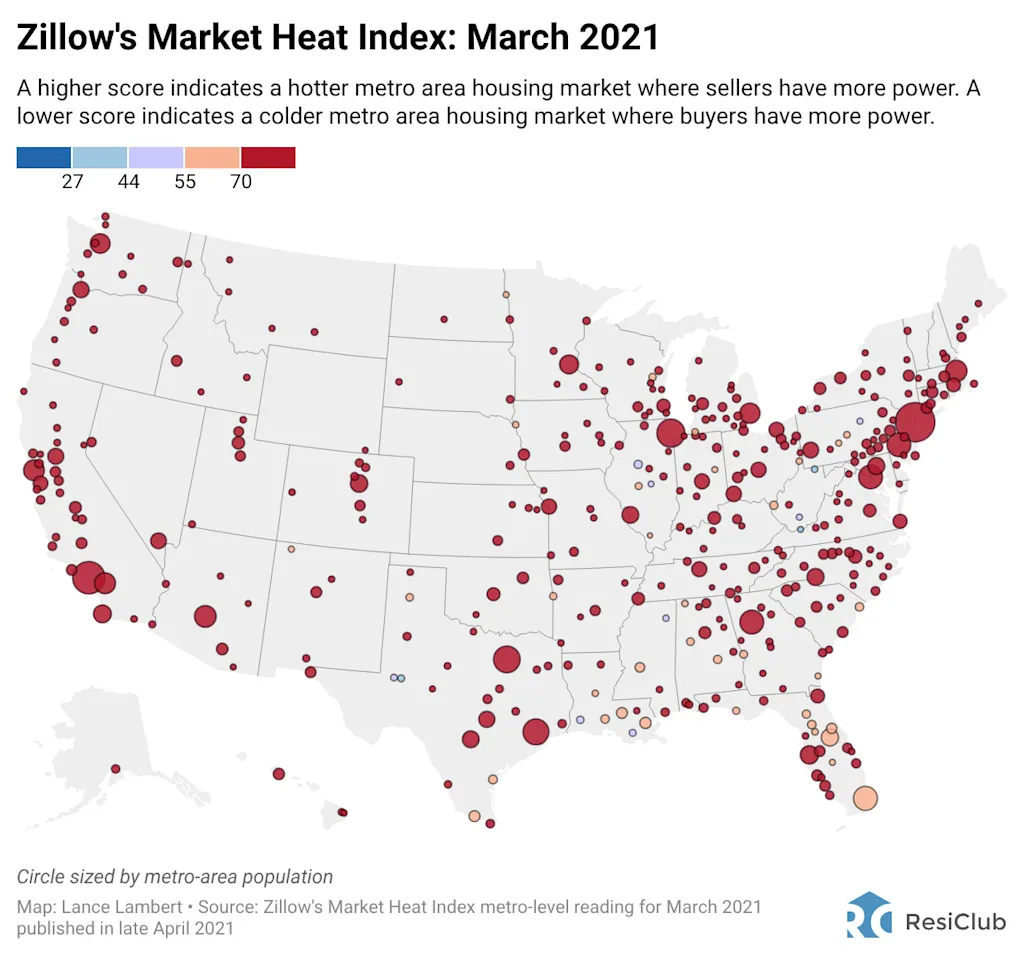
What did this Zillow analysis look like back in spring 2021, during the pandemic housing boom? Below is Zillow’s March 2021 reading—published in April 2021.